A couple weeks ago I was at the Catapult Hockey Workshop in Denver with a few dozen strength and conditioning coaches from the NHL and NCAA. While there, someone asked me about the Lateral Bound test, one of many “hockey power tests” I really like.
I’ve written about the Lateral Bound Test in the past, but if you missed those articles, you can check them out here:
- A Hockey-Specific Power Test
- Testing Power in Team Sport Athletes
In short, I think the Lateral Bound Test is more hockey-specific, and provides different (if not better) information than a Vertical Jump.
One of the biggest problems with testing is that most people don’t actually do anything with the information. This is likely the result of people not knowing what a “good” score is for many tests, and the difficulty in assessing one’s true genetic ceiling (e.g. if I’m better than everyone else, is that still as good as I can get?).
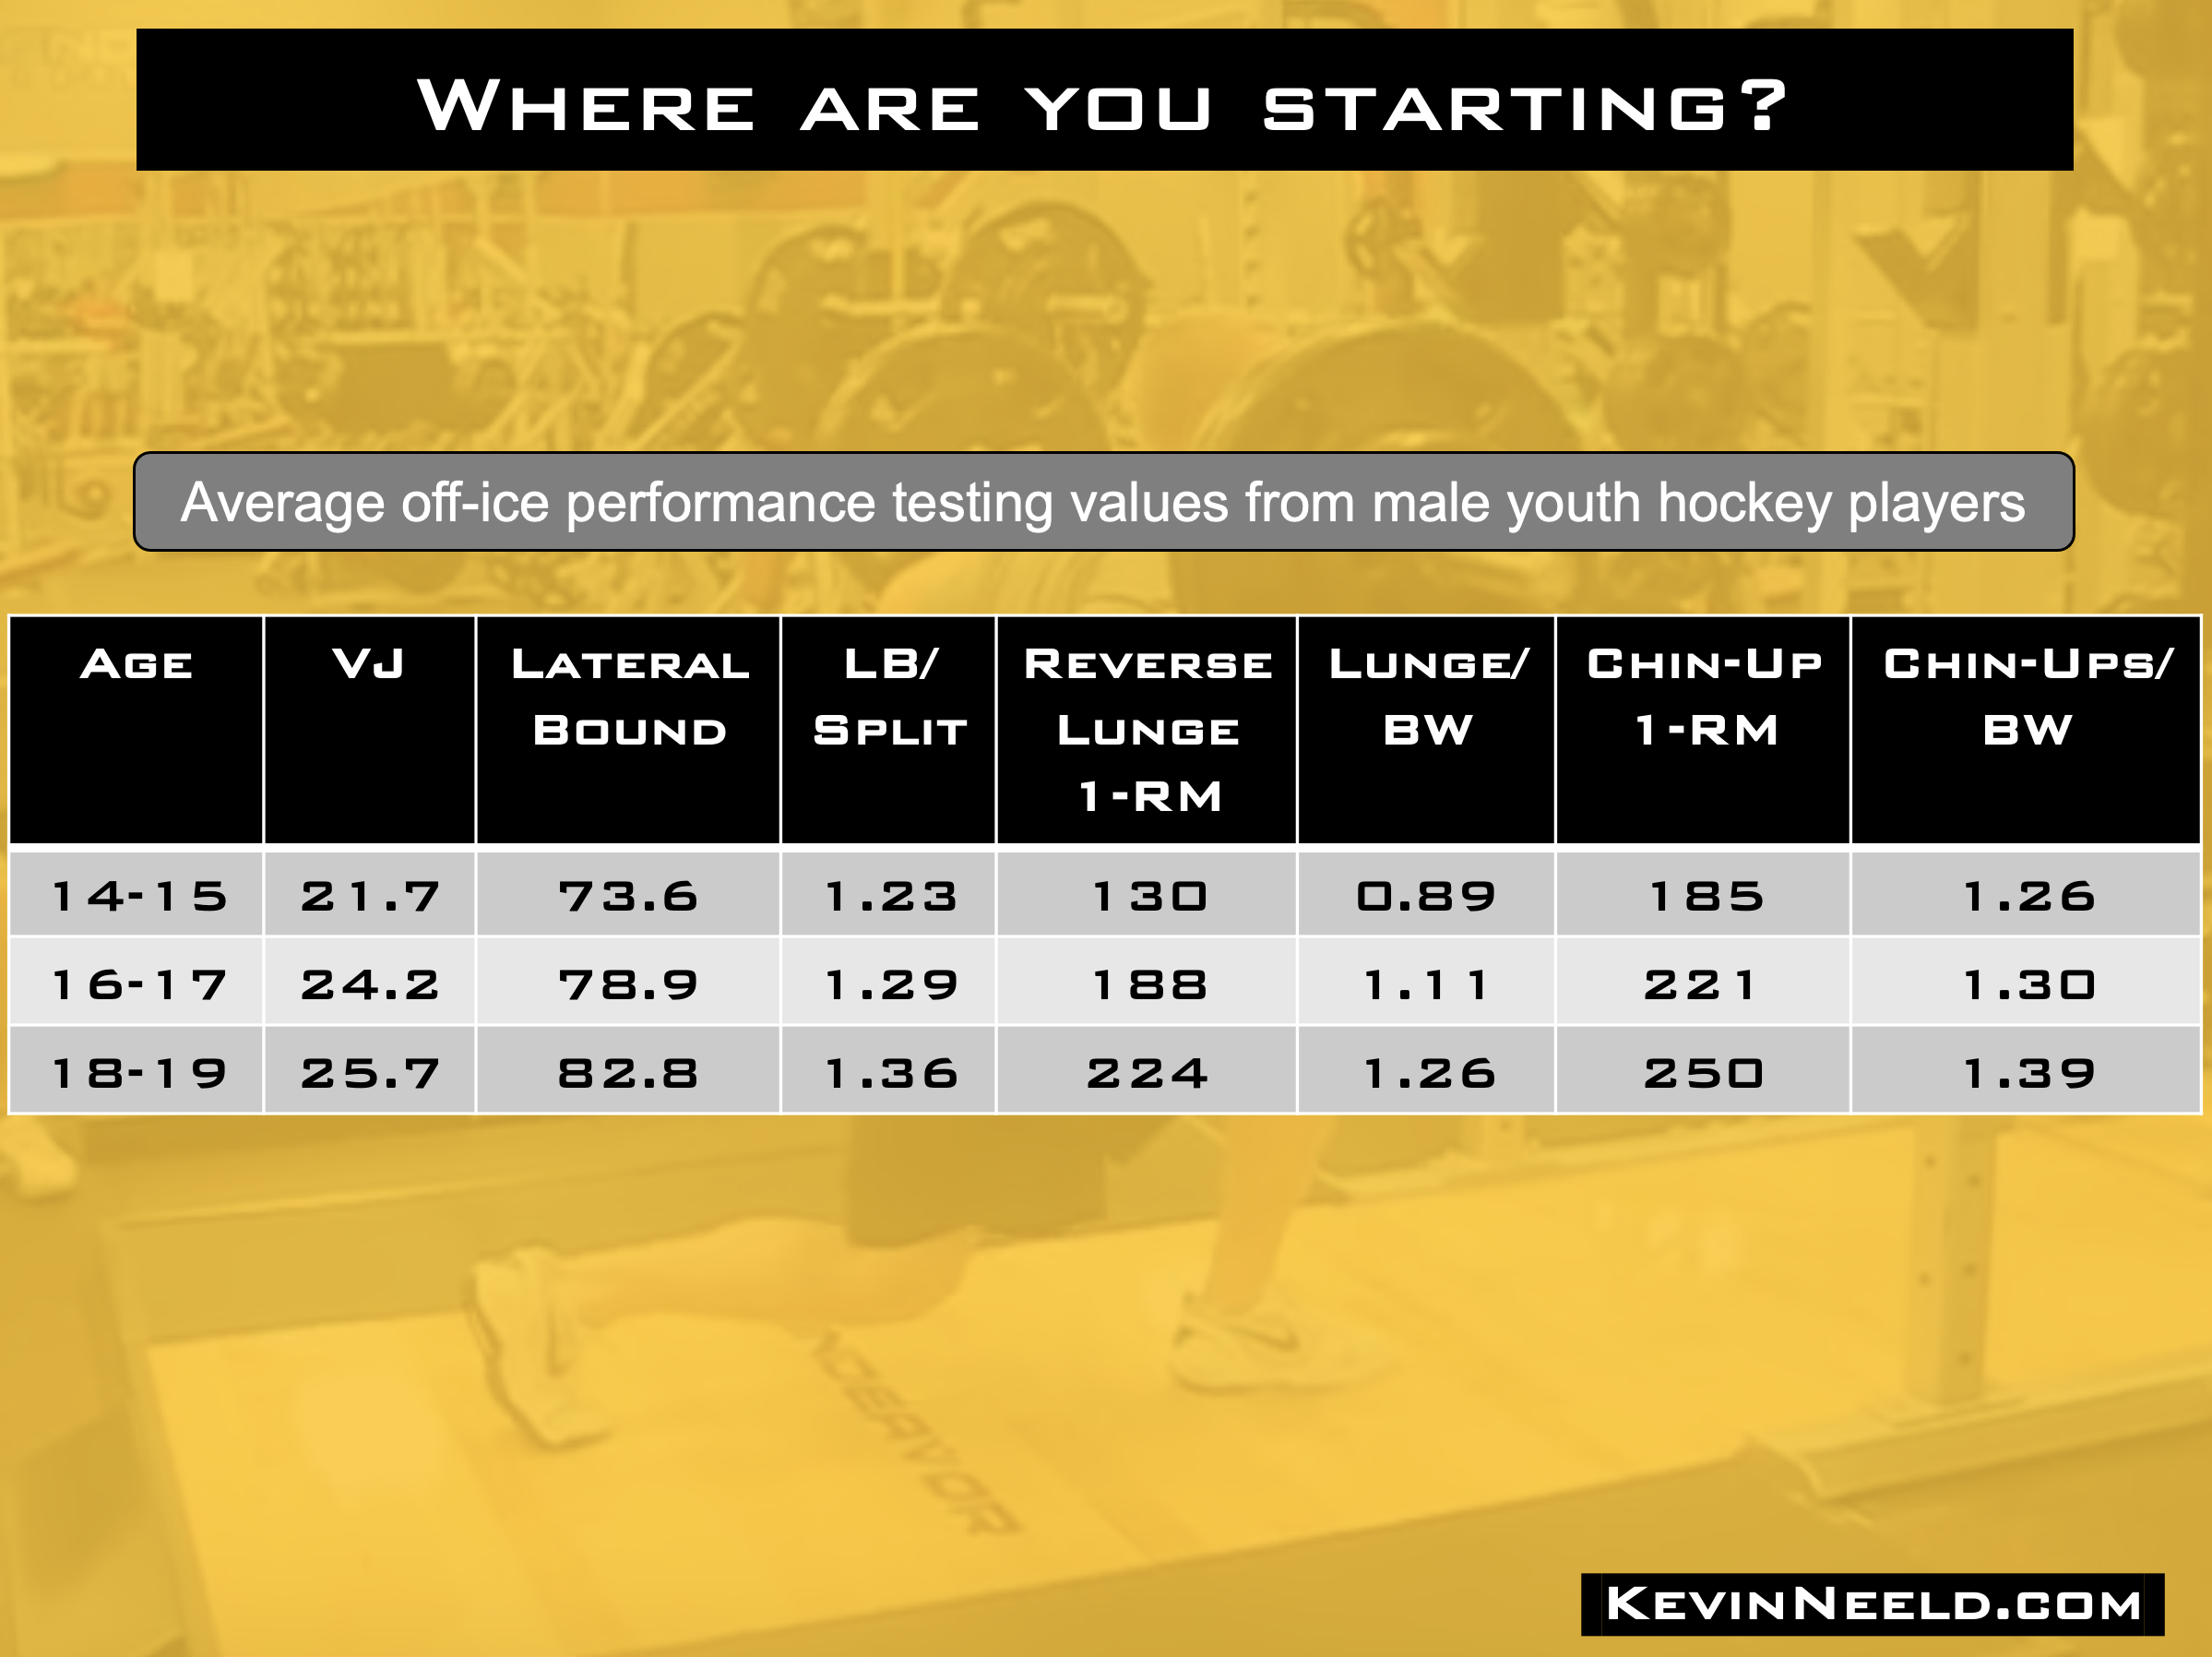
With these things in mind, I wanted to share some normative data from the hundreds of hockey players I’ve tested over the last few years. Hopefully this provides a basic target for you to measure your own status, as well as your progress moving forward.
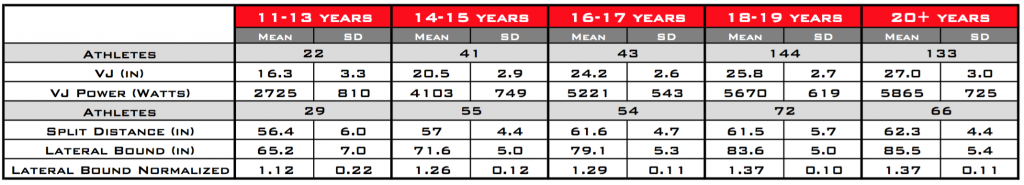
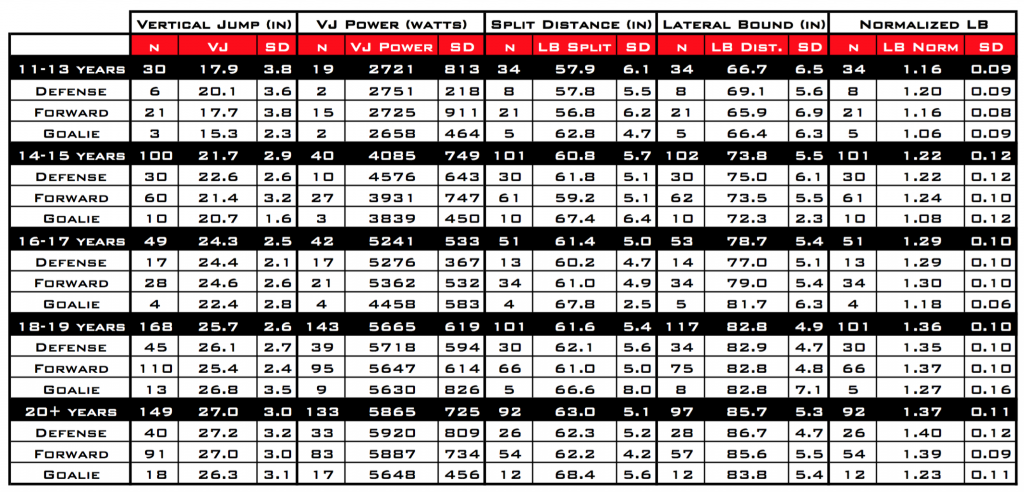
The above table shows the average and standard deviations for different age groups for Vertical Jump, Vertical Jump Power (using Sayer’s Formula to estimate the power based on vertical jump height and body weight), Split Distance, Lateral Bound Distance, and Normalized Lateral Bound Distance (Lateral Bound/Split Distance).
As a quick reminder, the split distance (discussed more in the Testing Power in Team Sport Athletes article) provides different information than simply a leg length test. In the 95 athletes I have leg length AND split distance data for, the two variables shared a correlation of only .163. That number should seem low, but to put it in perspective, leg length had a .103 correlation with percentage body fat.
The table also shows the number of athletes in each age group for each cluster of tests. I actually have A LOT more VJ and Lateral Bound data than this, but I included included VJ data where I also had VJ Power (we haven’t always assessed body weight in certain circumstances) and lateral bound data where I had split distance (this wasn’t part of the early testing procedures).
As a quick refresher, the standard deviation gives a general idea of the distribution of test scores. In a normalized distribution (as these scores were), ~68% of the population will fall within one standard deviation around the average, 95% will fall within 2 standard deviations (i.e. 34.1+34.1+13.6+13.6=95.4), and 99% will fall within 3 standard deviations (i.e. 95.4+2.1+2.1=99.6).
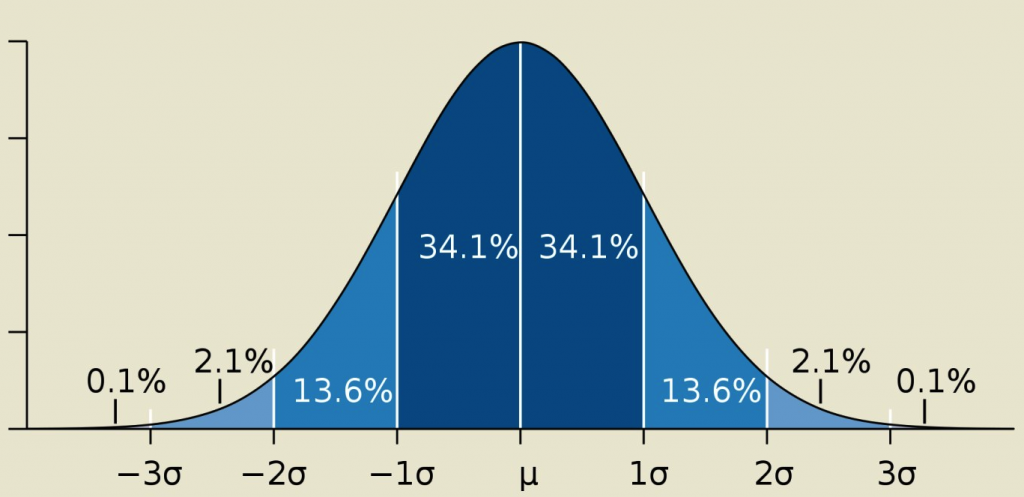
This same data can be used to estimate what percentile you fall in relative to the population. For example, if you’re 18 years old and your average lateral bound distance is 88 inches, you can use the standard deviations to write out these percentages:
- 50% = 83.6
- ~84% = 88.6
- ~97.5% = 93.6
- ~99.9% = 98.6
So your score of 88 inches would fall roughly in the 84th percentile.
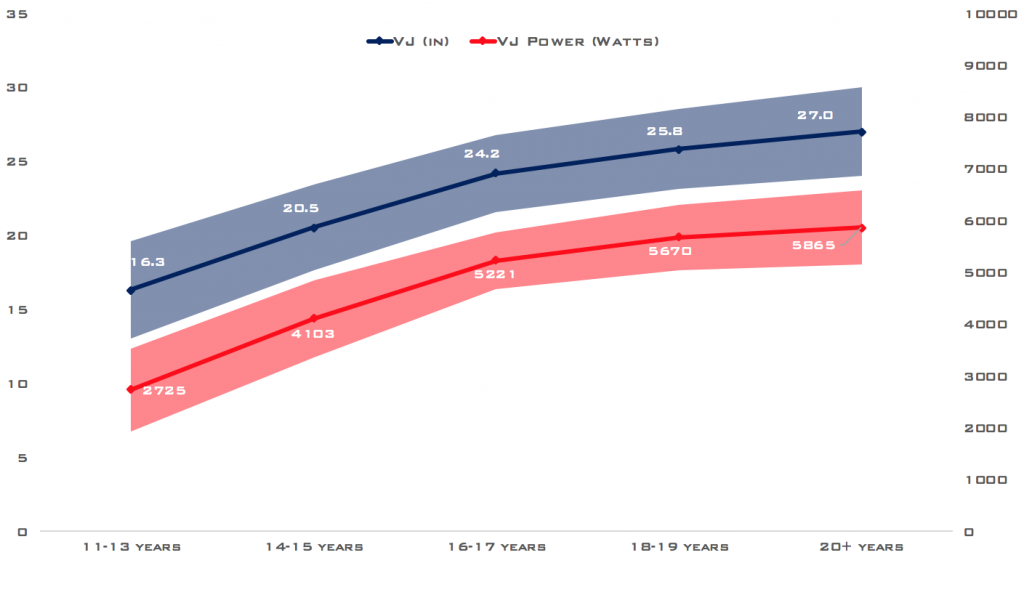 Vertical Jump (left axis) and Vertical Jump Power (right axis) normative data (presented as average +/- 1 standard deviation)
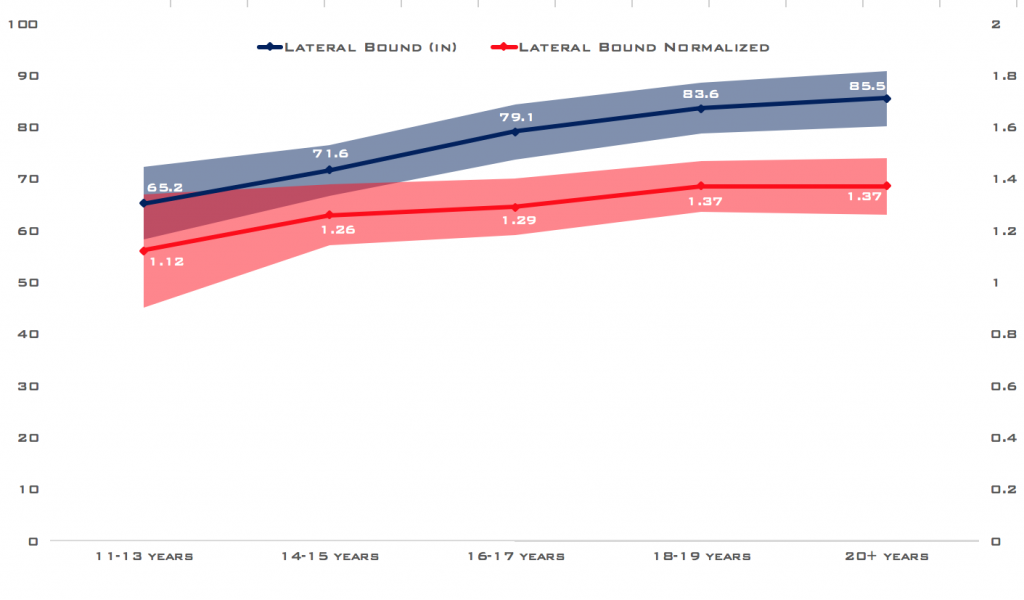
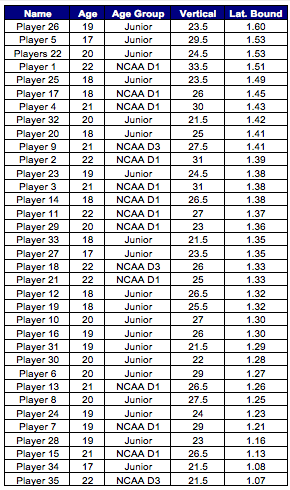
Lateral Bound (left axis) and Normalized Lateral Bound (right axis) normative data (presented as average +/- 1 standard deviation)
As I mentioned in a previous article, one of the benefits of using the lateral bound test is that it provides insight into side to side discrepancies that are otherwise hidden by a vertical jump (in the absence of a dual force plate). While you may think the differences between legs are relatively negligible, of the 446 lateral bound tests I have data on, 88 (19.7%) show a side-to-side discrepancy of 4 or more inches.
This is important because it could be indicative of a power and/or range of motion deficit on one side that may increase injury risk. At the very least, there’s no reason to believe this discrepancy is “optimal” and therefore it may warrant taking steps to normalize balance.
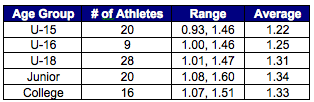
The last thing I wanted to look at is how these tests vary by position. For those of you that like to look at raw numbers, I’ve included the sample sizes, averages, and standard deviations in the table below.
For the rest of you, let’s just take a look at a few line graphs that simplify the message.
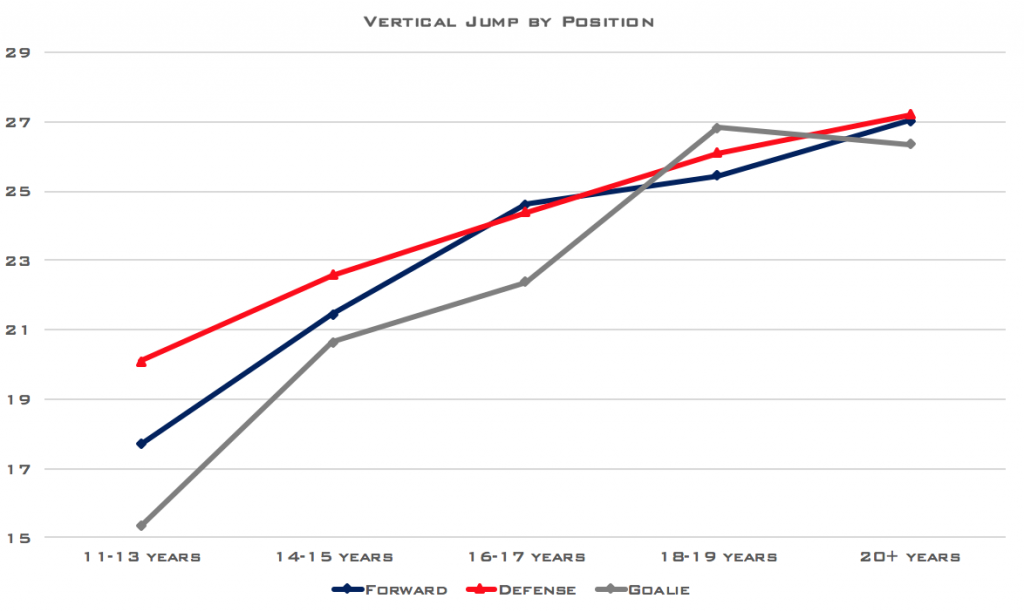
Vertical Jump by position. Note that goalies lag behind forwards and defensemen until ~18 years old.
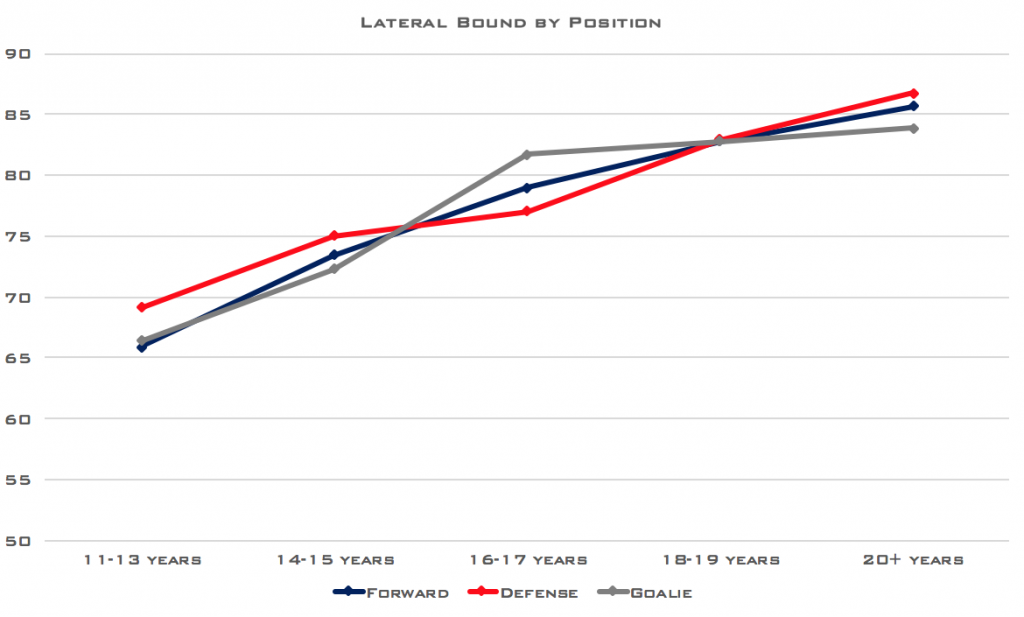
Lateral Bound by position. No notable differences between positions at any age group.
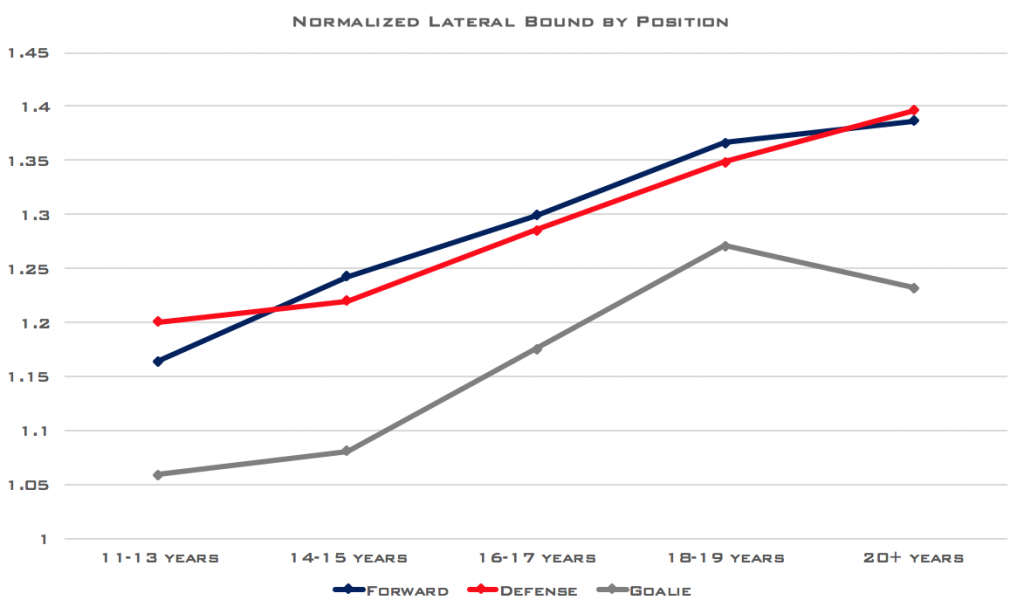
Lateral Bound Distance normalized to Split Distance. Once again, goalies are considerably lower than position players, but now it’s consistent across all ages.
There are several different ways to look at this position-specific data. Starting with Vertical Jump, it appears that goalies lag behind everyone else until Juniors/College. From personal experience, I think there are two major reasons for this: A) Goalies tend to over-emphasize flexibility training and under-emphasize…well, any other form of training, and B) At younger ages, it’s pretty common for the fattest and/or least athletic kid to get throw in net. I think most goalies would do better to put a great emphasis on training for speed, power, and strength IN ADDITION to their flexibility work at younger ages.
When we look at Lateral Bound distance, the raw numbers are difficult to interpret because we don’t know if differences are the result of leg length (unlikely), hip structure (possible), and/or flexibility (likely) differences between positions, or true power output differences. This is clarified by the normalized lateral bound graph. Here, the goalies are again significantly behind the other positions. In fact, at younger ages, their normalized values are barely over 1.0, which is the “I can jump as far as I can fall” threshold.
Again, I would argue that most goalies would benefit from improving the focus on their speed/power training in conjunction with their flexibility training. However, I also think it’s important to appreciate the nature of the position, and recognize that the goal isn’t necessarily to make all of the positions identical. The optimal ratio for most goalies is likely still below position players; however, goalies may feel more reactive on the ice if this gap is narrowed.
Wrap Up
The most important part of testing is to provide yourself with a baseline measure so you can track progress over time. Simply, if you beat your last test, you’re headed in the right direction. However, many players are interested in how they compare to others in their age group, and understandably so. After all, if you improve from worst to slightly better than worst (I call this “less bad”), it’s not nearly as meaningful as climbing into the “above average” category. With this in mind, the above normative values can be used as a guide to assess where you rank in terms of power production. Hopefully you can use this information as motivation to not just train harder, but also train smarter.
To your success,
Kevin Neeld
HockeyTransformation.com
OptimizingMovement.com
UltimateHockeyTraining.com
Please enter your first name and email below to sign up for my FREE Athletic Development and Hockey Training Newsletter!
Get Ultimate Hockey Transformation Now!
Year-round age-specific hockey training programs complete with a comprehensive instructional video database!

“Kevin Neeld is one of the top 5-6 strength and conditioning coaches in the ice hockey world.”
– Mike Boyle, Head S&C Coach, US Women’s Olympic Team
“…if you want to be the best, Kevin is the one you have to train with”
– Brijesh Patel, Head S&C Coach, Quinnipiac University

 Use CODE: "Neeld15" to save 15%