
Testing is an important part of the training process. Not only does it help coaches profile the athlete, and therefore make decisions about which areas require more attention from a training perspective, but it also provides a mechanism to track progress over time.
In a previous post, which followed all of the controversy surrounding one of the upcoming NHL Draft’s top prospects not being able to perform a single pull-up at the most recent NHL Combine, I presented averages on how our youth and junior hockey players performed on a chin-up rep max test, one indicator of upper body strength. If you missed that, you can check it out here: Ultimate Pull-Up Transformation
While there are many ways to test power in athletes, we started using a Lateral Bound Test in addition to some of the more traditional tests (e.g. Vertical Jump, Broad Jump, Hang Clean, etc.). Compared to other tests, this test provides:
As you can imagine, the lateral distance one can travel jumping off of one leg and landing on the other will be influenced by a few other confounding factors that need to be accounted for, namely:
Instead of attempting to measure all of these things individually, we simply calculate a “split” distance (as far as the athlete can spread his/her feet without putting hands on the ground) and normalize all jump distances to this. In this way, we account for how all of those factors affect the lateral movement.
The equation I used to calculate normalized lateral bounds was:
LB Norm = LB Avg/Split where LB Avg = (Lateral Bound Left + Lateral Bound Right)/2
The results from our pre-Summer testing are presented below:
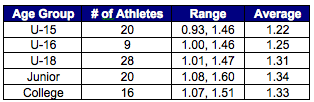
The general story is that athletes become more explosive as they get older (not surprising). It is interesting to the note ranges at each age group, as there are plenty of examples of junior- and college-aged players jumping on a “U-15 level” and vice versa.
Of even greater note is that the correlation between vertical jump height and the normalized lateral bound distance in our junior and college players (we did a broad jump with the younger kids for logistical reasons) was only 0.28. For those of you that shutter at the thought of analyzing statistics, that is essentially “not a very strong relationship”. In other words, the link between vertical jump and lateral bound performance is quite weak, suggesting that power is dependent upon which pattern it’s being expressed in.
I took the results from our Junior and College players and ranked everyone from best to worst according to their vertical jump height. The player with the best VJ was renamed “Player 1”, and each player was renamed accordingly until the player with the last VJ, who was named “Player 35”. I then re-ranked everyone according to their normalized lateral bound distance.
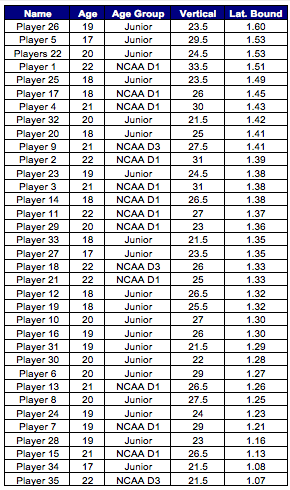
Lateral Bound vs. Vertical Jump Performance
As you can imagine, this list isn’t entirely random. The player with the best VJ (Player 1) had the 4th best normalized lateral bound. Similarly, the two players with the worst VJ were also dead last in normalized LB distance. That said, there are some notable outliers. The players with the 6th, 7th, and 8th best vertical jumps are all toward the bottom of the list for normalized LB. Likewise, the 3 of the top 5 best normalized LB performances were handed in by the 26th, 22nd, and 25th best vertical jump performers.
There are a few important take homes here:
As always, if you have any questions, please post them in the comments section below!
If you’re interested in following a structured hockey training system to improve your speed, power, strength and conditioning, be sure to check out my new Ultimate Hockey Transformation system today!

To your success,
Kevin Neeld
HockeyTransformation.com
OptimizingMovement.com
UltimateHockeyTraining.com
Please enter your first name and email below to sign up for my FREE Athletic Development and Hockey Training Newsletter!
 Use CODE: "Neeld15" to save 15%