A couple days ago, I posted an article comparing a few lower body power tests, and how they may or may not be “hockey specific”. If you missed that article, you can check it out here: A Hockey-Specific Power Test

A comment that I’ve gotten a few times, and something I had considered myself while interpreting the data, was simply that the lateral bound test would be confounded (or at least influenced) by the height of the individual. In other words, because it involves jumping off of one leg and landing on the other, having longer legs and therefore a larger lateral excursion would lead to increased jumping distances. I think it would be hard to argue that leg length doesn’t in some way influence a test like this, but it’s important to remember, as I noted in the previous post, that the ability for longer legs to equate to larger lateral excursions depends on a number of factors, notably pelvis structure and positioning, femoral head architecture and positioning, and length of the adductor complex on both sides. Bottom line is that when sifting through the data, many of the top achievers were among the smaller kids on the team and many of the bottom achievers were among the taller kids on the team. In short, there’s a lot more to the story than just how tall someone is!

Last Friday I had an opportunity to sit down over a cup of coffee and catch up with Joe Heiler from Sports Rehab Expert. I’ve known Joe for over 4 years now and I was fortunate to have a chance to contribute some articles to his site early in its evolution. Now, SportsRehabExpert.com is over 4 years old and has really grown into an incredible resource.

Sports Rehab Expert

With the recent release of my Optimizing Movement DVDs, Joe wanted to talk about some of the topics discussed in my presentations, including:

  1. An overview of the presentation: Who it’s for, what’s covered, and what people can expect from it
  2. The 4-step process to establish Optimal Movement in athletes and non-athletes alike
  3. Why the appearance of full mobility could actually be a bad thing
  4. The assessment process we use with our athletes and clients, and what I would use in a time crunch
  5. Some of my more “surprising” assessment findings
  6. The 4 “Pervasive Movement Considerations” that influence the correct performance of almost every exercise
  7. How we’ve used kinesiotaping techniques to restore mobility and reduce asymmetries
  8. How all of this integrates into our training system

Joe was kind enough to let me repost the interview here so you can listen to it for free. You can download it at the link below:

Click here to listen >> SportsRehabExpert.com Interview on Optimizing Movement

Optimizing Movement DVD Package

Optimizing Movement continues to get great reviews from those at both ends of the rehabilitation to elite performance continuum. This is what Penn State University Hockey Strength and Conditioning Coach Rob McLean had to say:

“In Optimizing Movement Kevin does an amazing job of laying out many of the dominant philosophies that are influencing our industry, and discusses how they influence his approach to training.  Much of the FMS, SFMA and PRI information is very complicated and yet Kevin presents them with a simplicity that allows you to grasp the concepts quickly and recognize how important it is to look for movement dysfunction. He then discusses how he evaluates his athletes and uses that information to direct his movement-based approach to create a training program that deals specifically with the athletes’ limitations. Lastly Kevin reveals overwhelming evidence to show that most athletes walking through our doors already are dealing with sub-threshold injuries that must be managed or else we, as strength coaches, will only make them worse and never achieve the best result possible for our athletes.

I try to review all the great information that is available every year from Cressey, Robertson, Reinold, Weingroff, Ward, Jamieson and many others. For me, Kevin’s Optimizing Movement was definitely the best DVD I’ve seen this year and I would consider it one of the best DVDs I’ve ever watched. This is the DVD that brought everything together for me and allowed me to implement my knowledge and define my core beliefs. I strongly recommend it to strength coaches or athletes who are looking for direction in applying these philosophies to create athletes that are more durable and move better.”

Rob McLean, Head Strength and Conditioning Coach, Penn State University Hockey

Check out OptimizingMovement.com for more information!

Next week I’ll be posting a couple articles discussing early in-season training programs for hockey players, so be sure to check back. In the meantime, enjoy the interview and don’t forget to stop by SportsRehabExpert.com to check out all of the articles, videos, interviews, and forum discussions!

To your success,

Kevin Neeld
OptimizingMovement.com
UltimateHockeyTraining.com

Please enter your first name and email below to sign up for my FREE Athletic Development and Hockey Training Newsletter!

Last week, I posted three articles that gave a fairly detailed look inside the recent testing process we went through with the Philadelphia Flyers Junior A team, how we reported this information back to the players and coaches, and how it immediately influenced our programs. If you missed those three posts, you can check them out here:

  1. Off-Ice Testing
  2. Hockey Team Testing: Player Reporting
  3. Hockey Team Testing: Coach Reporting and Programming

Today I wanted to expand on part of the testing process we did to assess our players’ lower body power. It’s generally accepted that power is an important quality to improve in hockey players. In fact, every Summer I hear players (or parents/coaches) reference needing to improve their “first few steps” or “explosiveness” more times than Walter references his experience in Vietnam.

The Big Lebowski

Over the line!”

While I don’t think anyone would argue the importance of power in hockey, the topic of how to assess/measure it is interesting. The vertical jump is the most widely used assessment of lower body power and one that is used at all levels in all sports. The vertical jump, however, has been critiqued as being a vertical pattern, which is less specific to the overwhelming majority of team sports that involve primarily horizontal vectors (the goal is to move forward, not upward). Within this context, it would seem that a broad jump may be more “sports-specific”. That said, and likely as you would expect, in athletes that are familiar with both patterns, there’s a pretty strong correlation between performance in the vertical jump and that in the broad jump. In other words, they’re likely assessing the same thing (or close enough to the same thing), so picking the one that makes the most sense in your situation depending upon logistics and what comparisons you want to make with the data (more widely available norms for vertical jump) is reasonable.

Enter the lateral bound as a lower body power assessment, which could be considered the most hockey-specific power assessment. The lateral bound is a single-leg, lateral, horizontal movement pattern, which is notably more skating specific than either a broad or vertical jump. It also gives the option of comparing side to side imbalances, which could result from a number of factors ranging from true power discrepancies to hip abduction limitations on the landing leg. Nonetheless, a significant difference between sides would at least highlight the athlete as one that may require a little extra attention.

As you may have read last week, with the Flyers junior team we tested vertical jump and lateral bound. The birds eye view of the thought process here is that a lot of teams test vertical jump so having that information on the players allows us, on a team and individual basis, to look at college and pro programs and see where our players stack up. The lateral bound, as I just mentioned, is a more hockey-specific pattern, and gives us the ability to look at side to side differences. In all honesty, I fully expected the ranking order between the two tests to be almost identical. After all, some of the kids are going to be more explosive than others, based on a number of factors, and this should show up in both tests.

And then I looked at the testing results…

There is certainly a degree of similarity in some cases, but if I take the rank from the vertical jump test and rerank based on the average lateral bound between legs, this is what shakes out:

  1. 1st Lateral Bound: 1st VJ
  2. 2nd LB: 15th VJ
  3. 3rd LB: 5th VJ
  4. 4th LB: 4th, 7th, and 10th VJ tied
  5. 7th LB: 22nd VJ
  6. 8th LB: T-2nd VJ
  7. 9th LB: 13th VJ
  8. 10th LB: 15th VJ
  9. 11th LB: 19th VJ
  10. 12th LB: 9th VJ
  11. 13th LB: 7th VJ
  12. 14th LB: 4th VJ
  13. 15th LB: 19th VJ
  14. 16th LB: 10th & 23rd VJ tied
  15. 18th LB: 5th, 18th, & 19th VJ tied
  16. 21st LB: 10th and 15th VJ tied
  17. 23rd LB: 13th VJ

Plotting lateral bound distance versus vertical jump height looks like:

Hockey Power Test Comparison

Clearly, if you remove the one “best of both worlds” and the one “needs improvement in both worlds” (for the sake of defending his honor, this player spent the last 6 weeks of the Summer recovering from a concussion and not training), what’s left is a non-linear cloud of jumbled testing results. This is evident if you sift through the data in the list above and note all of the high achievers in one power test that weren’t so consistent on the other.

As you may suspect, there is a degree of familiarity that will influence these tests. Players that have used these movements in their programs (e.g. practiced them) more will perform closer to their true potential than those with a less refined pattern. Having seen all of these tests, however, I don’t think this is the main confounding issue here. A few months ago Dean Somerset wrote a great article on Eric Cressey’s site (see: Pelvic Arch Design and Load Carrying Capacity), that explained how certain people have different hip structures that make lateral movement more difficult, and how these structures may influence performance in different exercises.

4 Pelvis Types

The wider arches may be more conducive for lateral movements.

Interestingly, but not necessarily surprisingly, this seems to be the primary factor in explaining some of the discrepancies we saw between vertical and lateral power. Those with structures not conducive to large lateral movement/excursions have an opportunity to demonstrate their lower body power more effectively in a vertical or broad jump movement than a lateral bound. Ultimately, the goal is always to improve their on-ice speed and testing results are always better suited for tracking progress than comparing individuals, but this seems to provide evidence that including multiple tests will help ensure you’re capturing all of the information you need to profile a player’s strengths and weaknesses. In this case, if we would have only looked at the most “hockey-specific” test, it would have been easy to conclude that some of the players were under-powered, when the reality is that they just have a different hip structure than some of the other guys. Once again, this highlights the importance of appreciating the individual variations players have in their hip structures and the impact this can have on their performance. If you don’t currently have a good assessment process or feel comfortable recognizing if a limitation is structural or functional, check out Optimizing Movement, which details the approach I’ve used for the last several years with our athletes.

To your success,

Kevin Neeld
OptimizingMovement.com
UltimateHockeyTraining.com

Please enter your first name and email below to sign up for my FREE Athletic Development and Hockey Training Newsletter!

In the last two segments of this series, I outlined the exact pre-season testing we did with the new USPHL team I’m working with this season, and how I present the testing results to players. If you missed those posts, you can check them out here:

  1. Off-Ice Testing
  2. Hockey Team Testing: Player Reporting

Today, I want to expand on the player reporting post by sharing how I conveyed this information to the coaching staff as well as how I use it to dictate the player’s programs.

Coaches Report
When thinking about how I wanted to convey testing results to the coaching staff, I tried to put myself in their shoes and consider what I would want to know. Naturally, the idea is present the data in a way that answers the questions, “What did you test?” and “How did everyone do?”

What did you test?In typing up the coaching report, I identified and described the body composition test and each of the performance tests we did. The descriptions included the purpose of the test, how to interpret the results, and any notable limitations. These sections were meant to give the coaching staff a basic understanding of the point of each test and a means of interpreting the information. As an example, we used a 3-site skinfold body fat analysis. At our facility, I typically use a 12-site analysis and analyze the information using both Poliquin’s BioSignature Modulation and a simple 7-site equation. With a team’s worth of kids to test and not much time to do it, performing a 12-site analysis on each player wasn’t realistic. I don’t put a lot of stock in the 3-site as far as knowing exactly what the individual’s body fat is, but it still serves as a good screen to identify players that will need to reign in on their nutrition during the year and helps connect some dots regarding any connection between body composition and the other performance test scores we see. This, I feel, is important for the coaches to be aware of; in this case the test is more of a screen for outliers than anything else.

How did everyone do?In each section, after identifying and describing the tests, I broke down the data into three sections:

  1. Team Summary
  2. Whole Team Performance
  3. Performance By Position

The Team Summary included the Best, Worst, and Average scores for the team as a whole, the forwards, the defensemen, and the goalies. This provides a birds eye view of the average and range of performances on each test. The Whole Team section included each players performance ranked from best to worst. This expands on the Team Summary by showing the coaches exactly how each player performed and where they fell relative to the team. The By Position section expanded on this same concept by showing the data by position. In this format, the coaching staff can see how the team did, how each individual did, and how players rank against their teammates, both in terms of the team as a whole and by position. Ranking by position I feel provides more information than ranking the whole team together because it rules out being ranked higher or lower based on position-specific adaptations.

At the end of the Coaches Report, I included all of the individual Player Cards so the coaches could see all of the testing for a given player in one place, see how this information would be conveyed to the players, and see the notes I included for each player. For the players I had prior testing data for (those that trained with us this Summer), I also included their pre- and post- comparisons so they could see how each kid progressed over the off-season. In total the report was 48 pages, but it had all the information I wanted to get across!

Programming Considerations
There are a lot of different ways to utilize the data we collected, but how we’ve moved forward depends a lot of logistics and on other goals of the program. To address this latter point, this team is about two weeks old at this point, so a major goal is to start to establish an identity. In other words, we, as a team, need to develop the culture for how things will be handled off the ice. To a lot of these players, EVERYTHING is new, from training as a team in general, to the exercises (and their names), to the layout of the program. As a result, we’re keeping things fairly basic in the lifts, with the intent of teaching key movement and positional concepts that will create a foundation to build off in the future. As far as applying testing data, testing loads will be used to drive percentage-based training load recommendations for a number of lifts moving forward.

USPHL Flyers Testing

Matt Siniscalchi and Matt Sees spotting the kids during their Bench Press 3-RM Test

The neutrality/mobility assessments were used to create each player’s corrective algorithms, with players having as few as 2 and as many as 4 corrective exercises that they’ll need to do on a regular basis. The correctives are basically a mix of exercises based on PRI and FMS methodology, as I describe in Optimizing Movement. The players are put into buckets based on their specific findings, such that each player has an individual corrective sequence, but there are really only 9 different exercises that we need to teach. In this way, we can deliver exactly what the player needs without being overwhelmed by teaching each player completely different exercises from each other player. Realistically, the first time or two through (in a team setting) is always just a learning process, and the real “magic” won’t take place on a team basis until everyone gains a basic level of mastery over their exercises.

Similarly, players are given extra conditioning work based on their assessment findings. Through our conditioning test, we were able to get:

  1. Fastest Shuttle
  2. Shuttle Average
  3. Sprint Decrement (A statistical measure assessing drop-off from the initial sprint with each successive sprint)
  4. Max Heart Rate
  5. Average Heart Rate
  6. 60s Heart Rate Recovery
  7. Estimated Anaerobic Threshold

Using all of this information, we’re able to gain some insight into what an individual’s conditioning needs may be an add in some extra work to keep them moving in the right direction. Naturally, the majority of the training stimulus for the kids is coming from on-ice work at this time of year, so we don’t want to bury them with off-ice work. The general schedule at this point is:

  1. Day 1: Day 1 Team Lift; Individual Correctives
  2. Day 2: Individual Correctives; Individual Conditioning
  3. Day 3: Day 2 Team Lift; Individual Correctives
  4. Day 4: Open Hours for Manual Work; Extra work dependent upon upcoming game schedule

As I’ve said in the past, in my mind everything is always a work in progress and always in some part of an evolution. The assessments, corrective algorithms/exercises, program design methodology, and scheduling I’ve set up for this program will invariably change as the season goes on and in future years, but hopefully this series gives you an inside look into my philosophy and how I’m approaching things currently. As always, please share this series with your friends and post any comments you have below!

To your success,

Kevin Neeld
OptimizingMovement.com
UltimateHockeyTraining.com

Please enter your first name and email below to sign up for my FREE Athletic Development and Hockey Training Newsletter!

A couple days ago I outlined the entire testing process we went through recently with the Philadelphia Flyers Junior Team. This included everything from test selection through implementation, and how we coordinated everything to ensure we got the most valid information, without overlooking the main intent of the camp: to prepare the players for the season. If you missed that post, you can check it out here: Off-Ice Testing

Flyers Logo

Today I want to follow up on that post by sharing how I convey this information to the players. One of the great things about this level is that it’s a developmental league. While there is no doubt there is an expectation (and a desire) to win, ultimately the goal is to develop the players to be successful at the next level. This is important because it means the kids are hungry for information that will help them become better players, which feeds into both why we tested the things we did, and how we’re going to use that information.

I’ve been collecting information on our off-season hockey group for years. The majority of the time, the information was purely mobility based and was used to drive our corrective exercise and technique modifications throughout the Summer. I think two big mistakes I made in the past was that I didn’t fully explain to players why this information mattered (e.g. how it would affect their performance or durability), and I didn’t show them how they improved following any of the work they did. Despite most players trusting me, there’s something about seeing the off-ice testing data that is very powerful. For that reason, I have developed “Player Cards” to convey testing data to all of our players. These player cards take two forms:

  1. Single-test presentation
  2. Multiple-test presentation

Single-Test Presentation
This is only something I’ve used with this junior team and not with our off-season kids, as a lot of what I include in this sheet isn’t relevant for a diverse group that will leave to go play on different teams and at different levels. On this sheet, all of the individual’s testing information is presented in an organized, fairly simple manner. Players are also presented with the top performance and how their test ranked, both in terms of their position and for the team as a whole.

If you’ve been reading this site for a while, you likely know that I don’t think comparing players based solely on testing data is very efficacious. The best players aren’t always the most remarkable off the ice (especially at this age), and the true ranking of players should be done ON the ice. That said, I think there is value in using a ranking system as a means of communicating areas of improvement to players. If a player is dead last in their average shuttle time and has the team’s worst body fat percentage, that could open the door to a conversation on how improving his nutrition could improve his conditioning. Similarly, if a player has the teams lowest (or near lowest) vertical jump, and the coach tells me the biggest factor holding the player back is his speed/explosiveness on the ice, this allows me to communicate to the player how these things could be related and will help with getting the player to buy-in to the program. A testing score, in isolation, really doesn’t mean a whole lot in most cases. By putting things in context of the rest of the group, it provides a “this is where you are relative to other players at your level” that is easy for players to understand, and in many cases very motivational.

You can check out a sample of this sheet here: Sample Player Testing Sheet

You’ll see that I also include a notes section at the bottom. I use this section to convey the top “red flags” or areas to work one that I pick up from the testing sheet. Given the amount of information on these sheets, it’s easy for a player to become overwhelmed or misinterpret some information. For example, if one of our mobility assessments is identified as being “Limited”, that isn’t necessarily a bad thing, depending on the results of the other tests and on the player. Jotting down a few notes at the bottom streamlines the player’s attention to what he should be focusing his efforts on in the immediate future.

Multiple-Test Presentation
As I mentioned before, players want to know they’re making progress. In addition to some periodic monitoring throughout the Summer, we retested everything we did at the beginning of the Summer with all of our players. This information is set-up into a basic excel spreadsheet with all the body comp and mobility information from each testing period (pre- and post-Summer) pooled on one sheet, and all the performance testing pooled on another. As a group, this allows me to sit down and sift through all the numbers to make sure that the group as a whole is moving in the right direction, which can influence future programming considerations. I then take all of this information and divide it up into individual spreadsheets so I can just add future testing sessions as a new row each testing bout.

This allows me to easily track progress for a player and adjust future programs when necessary. It also allows me to put an individual’s testing results within context. For example, we had a player on the junior team whose vertical jump test was toward the bottom of the team. Naturally, it would be easy for the player to look at that information and become discouraged. However, this player put on 10 lbs of lean mass and added 4″ to his vertical in the 3 months he trained with us this off-season. Even though he’s toward the bottom end of the team, he’s made remarkable progress since he started.

This Summer, I emailed all of these sheets out to players and highlighted a few things that they should be proud of, and a few things that they should continue to focus on during the year. With this, players are able to see their progress as well as have an indication of where to focus their efforts moving forward.

In the next post, I’ll discuss how I present the testing information to the coaching staff and how I use this information to drive programming decisions. Check back tomorrow and please post your comments below!

To your success,

Kevin Neeld
OptimizingMovement.com
UltimateHockeyTraining.com

Please enter your first name and email below to sign up for my FREE Athletic Development and Hockey Training Newsletter!

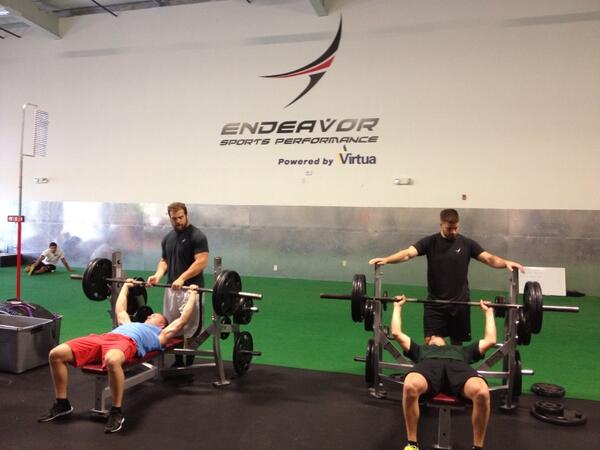
In addition to my current responsibilities at Endeavor, I recently started as the Head Strength and Conditioning Coach and Manual Therapist for the Philadelphia Flyers Junior A team, a Junior A team that formed locally as part of the newly formed United States Premier Hockey League (USPHL). This is a really fun and exciting opportunity for me. Those of you that know me well know that, despite loving my job, I miss being in a team setting. There’s something about the long grind of a season, and working together to pursue a common goal that really drives me. Additionally, because the team is brand new and I know the Head Coach so well, I have a lot of freedom that probably isn’t common for S&C Coaches that are new to a team. Having the ability to communicate openly and effectively with a coach can have a profound impact on team performance, as it creates a more cohesive program, syncing off- and on-ice plans, sending consistent messages to players, training/coaching a player based on individual weaknesses as relayed by the coach, etc.

usphl
A few weeks ago, the team opened with camp and we dove right into testing. For the reasons I mentioned above, I had the ability to design the entire testing process exactly as I wanted. The three primary considerations here are: 1) Test selection; 2) Scheduling the testing sessions to get the information I wanted; and 3) Organizing the testing logistically to ensure it’s a smooth process. Today’s post outlines exactly how we conducted the testing process. My hope is that this will stimulate some discussion with those of you that work in team settings and either utilize different tests or don’t test at all. Please post your thoughts in the comments section below!

Test Selection
This process will depend heavily on the philosophy of the strength and conditioning coach. I look at it from two perspectives:

  1. What information do I want from an tracking/analysis perspective?
  2. What information do I want from a programming perspective?

In this case, I wanted to get an indication of where each player stood in terms of joint neutrality and mobility. For the players that trained with us all off-season, this is a standard part of the “retest” process that allows us to track how much players improved. In the rare case that they didn’t, it allows us to start asking different questions, place a greater emphasis on manual therapy work, or refer them out to someone with different skill sets. For new players, it gives us a baseline of where they are so we can track their changes over time, and also serves as an identifier of any “red flags” that may require immediate attention.

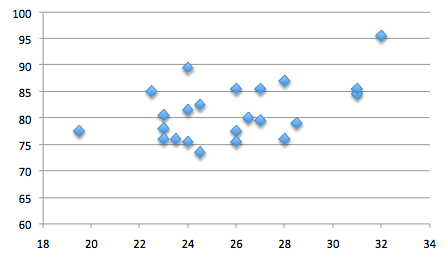
In terms of performance, my goal was to collect information relevant to our future programming, while simultaneously collecting enough information to physiologically profile the athletes. In simple terms, I want to be able to pick out the players that fall on either extreme end of the continuum from the high power, poor endurance players to the high endurance, poor power players. This gives me information to discuss goals with the player, discuss how these things may be influencing on-ice limitations in the coaches eye, as well as to drive any individualization from a programming or nutrition standpoint.

Our testing battery included:

  1. Neutrality/Mobility
    1. 3-Site Body Fat Analysis
    2. PRI Assessments of Neutrality/Ligamentous Integrity: Extension Drop Test, Adduction Drop Test, Passive Abduction Lift Test, Shoulder Internal Rotation, Shoulder Flexion, and Horizontal Shoulder Abduction
    3. FMS Assessments of Mobility: Active Straight Leg Raise, Shoulder Mobility, Ankle Mobility (not formally part of the FMS-7), and Cervical Spine Screens I took from the SFMA
    4. Quadruped Rock
    5. Seated Hip Internal and External Rotation
  2. Performance
    1. Vertical Jump
    2. Lateral Bound
    3. Reverse Lunge (Back Squat Grip) 5-RM
    4. Bench Press 3-RM
    5. Chin-Up Rep Max
    6. 12 x 50-Yard Shuttles on 30s
      1. Average Heart Rate
      2. Maximum Heart Rate
      3. 60s Heart Rate Recovery

Scheduling the Tests
My major concern with the test scheduling was ensuring that I’d get accurate data. If the information collected isn’t accurate, it’s impossible to interpret. For example, if you want to know a player’s maximum vertical jump height, it’s unlikely you’ll get valid information if you assess this after they skate. Similarly, it wouldn’t be ideal to perform a lower body strength test before a lower body power exercise, as fatigue from lower body strength testing is more likely to interfere with a single-effort power test than vice versa. This is not only important from a within testing day perspective, but also from day to day, as soreness will inevitably effect testing performance as well.

For this reason, we set up the schedule as follows:

  1. Day 1: AM: Body Comp, Neutrality, Mobility Testing; PM: Practice
  2. Day 2: AM: Power, Conditioning Testing; PM: Practice
  3. Day 3: AM: Strength Testing; PM: Practice
  4. Day 4: AM: Practice; PM: Training Session
  5. Day 5: AM: Practice; PM: Training Session
  6. Day 6: AM: Practice; PM: Training Session
  7. Day 7: PM: Scrimmage

This set-up allowed us to get testing numbers from the kids while they were fresh. The practices during the first three days were light so the players had plenty of gas in the tank for off-ice testing. Naturally, it doesn’t matter if the players are off-ice phenoms if their on-ice skills aren’t refined/prepared. The extra skill work early in the week, followed by having skates before training sessions, and training sessions that were more oriented toward teaching fundamental movement patterns we’ll be using a lot this season allowed a smooth transition from a testing to on-ice preparation focus.

Logistics
Some testing protocols were easier to organize than others, but the general layout looked like this:

Day 1
This was the most difficult one to handle, as there were lots of kids and lots of tests. We split the team into two groups, each blocked for an hour. When the players arrived, they would come to me for body fat, Matt Siniscalchi for a couple of the FMS tests, Matt Sees for a couple of the FMS tests, and then back to me for the remaining tests (after I had finished everyone’s body fat). In hindsight, this ran very smoothly, but we could have easily done it with just two coaches.

Day 2
The entire team came in at once. After we warmed up together, half the team went to do the Vertical Jump, the other half went to Lateral Bound. When everyone was finished testing, we swapped. This took about 15-20 minutes total. We then divided the group into 4’s to do the shuttle test. Each group took about 7 minutes so the last group had a pretty significant wait. We told guys to start rewarming up with some basic locomotion exercises when the group before them hit the half way mark, so no one was cold going into the test. While I wasn’t thrilled with having guys wait so long, I think it was good to have the entire team there to support their teammates, as this is a brutal test. Like the previous (and next) day, we had a 2-hour block scheduled to get through everything, but we ended up finishing pretty early.

Day 3
This was the easiest day to handle logistically. The team was again divided into two groups with an hour block dedicated to teach. Each group would come in, foam roll, go through a group dynamic warm-up, and then do the reverse lunge, bench press, and chin-up tests. The biggest hurdle here is that many of the players that hadn’t trained at our facility had never done a reverse lunge, so there was a bit of a learning curve. With the new guys, we emphasized that it was more about learning the movement and getting an estimation of where they were at so we could use those loads for programming more than setting a world record. There were some ugly reps throughout the morning, but overall everyone did a great job. Most kids are more familiar with bench pressing so that test ran smoothly and the chin-up test is always quick and easy because it’s only one set.

From a performance standpoint, I think this process is probably very familiar to most of the strength and conditioning coaches out there, at least those working in college or professional settings. What may be more novel is all of the neutrality/mobility testing we do, as I’ve gotten a lot of questions from people over the last year about how to integrate this information into a group or team setting, and how it’s used to alter programming. These are the exact topics I covered in my new DVD Optimizing Movement, which has been getting awesome feedback from the people that have checked it out.

“Kevin’s passion and knowledge shine through in this DVD set. He is able to teach so that a strength coach/personal trainer of any level will understand, leaving you with a hunger to learn more and an excitement to move on to the next slide. This industry is filled with information on maximizing movement quality but Kevin’s Optimizing Movement DVD is my go to. He starts from the ground up discussing the importance of setting a sound foundation for a client, using assessments to identify limitations they may have and corrective exercise to build a program fit to the individual’s needs. I refer back to the DVDs often and learn something new each time. All strength coaches and trainers will benefit from this awesome resource!”

Caitlin Vassello BS, CSCS
Strength and Conditioning Coach
Tier 4 Coach at Equinox

If you work in a group/team setting, and want to learn more about how to assess your clients/athletes and make their program and your coaching cues more individualized, Optimizing Movement will be right up your ally!

Optimizing Movement DVD Package

In the next two posts, I’ll discuss how I’m communicating testing results to the players and to the coach, and how I’m using testing results to drive programming decisions. Stay tuned, and as I mentioned before, please post your comments below!

To your success,

Kevin Neeld
OptimizingMovement.com
UltimateHockeyTraining.com

Please enter your first name and email below to sign up for my FREE Athletic Development and Hockey Training Newsletter!

Use CODE: "Neeld15" to save 15%