Heart rate tracking and heart rate variability (HRV) have received increasing levels of attention from the strength and conditioning community over the last several years. A little less than a year ago, after watching a video of a presentation Joel Jamieson gave on energy system development, I started digging deeper into the research on heart rate variability and its various applications. What I started to find was there were several lines of fascinating research in validating HRV measurements, determining what different measurements meant physiologically, and what this information may mean for the athlete.
As a preface, I am FAR from an expert in this area. I had an exceptionally superficial introduction to these concepts in an exercise physiology class as an undergrad, and a familiarity with the benefits of variability from a neurological standpoint from my graduate studies in exercise neuroscience, but for all intents and purposes, this is new stuff for me. I’ve been fortunate to have guys like Mike Potenza, Patrick Ward, Dave Tenney, Joel, Mike T Nelson and his friend James Heathers (who I know as a researcher from Australia) to help me connect the dots. That said, I defer to these folks on this subject matter and encourage you to look into their work if you’re interested in more information. That said, I want to outline some of the basics of HRV and my interpretations of the immediate application of these concepts.
Understanding Heart Rate Variability
Heart rate variability is essentially a measure of the time between successive R-R intervals in the QRS waves of an electrocardiogram (ECG).
The various components of an ECG output…this is what you see next to the hospital beds that make the beeping noise.
While my understanding is that the “P-Q-R-S-T” denotation is somewhat arbitrary, each of these points and their associated influence on the waveform have physiological relevance. The “QRS-complex” represents ventricular depolarization, which essentially signifies the time at which the right and left ventricles contract and eject deoxygenated blood to the lungs and oxygenated blood to the rest of the body, respectively.
The variability in time between successive R-R intervals was initially recognized as an important measure due to associations between lower variability and various cardiavascular diseases/events. To be overly simplistic, within this frame more variability was indicative of a “healthier” more resilient cardiovascular system, whereas less variability indicated a greater degree of risk. One example of the potential benefits of having greater variability lies in the respiratory sinus arrhythmia (RSA). Put simply, RSA describes a phenomenon where under certain circumstances, an individual’s heart rate will increase during inhalation and slow during exhalation. The rationale is that the expedited blood flow during inhalation provides an opportunity for increased oxygen delivery to the depleted blood. The more variable heart beat, in this example, provides an opportunity for more efficient oxygenation, although there is some debate as to the power of this relationship as RSA tends to disappear during times of higher intensity activity, when it would seemingly be most important to maximize oxygenation of depleted blood.
Since this initial body of work linking low HRV with cardiovascular insufficiencies, HRV has been associated with a number of other ailments, including glucose regulation, hypothalamic-pituitary-adrenal axis function, and inflammation. HRV has also been dissected to a much greater degree such that HRV is now being measured in both the time and frequency domains, with various measures within each. Interestingly, researchers have attempted to use the frequency domain measures to differentiate physiological associations.
Digging into some of the notes I took from a 2009 paper by JF Thayer titled “Heart Rate Variability: A Neurovisceral Integration Model”:
An alternative, more simplistic interpretation of HRV data is that higher HRV measures (or measures of higher HRV frequencies depending on whether these are being analyzed using time or frequency domains) are associated with activity of the parasympathetic nervous system and lower HRV measures are associated with activity of the sympathetic nervous system.
As a quick recap, the nervous system is broken down into two primary categories: the central nervous system (CNS), which consists of the brain and spinal cord, and the peripheral system (PNS), which consists of the cranial and spinal nerves. The PNS can be further divided into two branches known as the somatic nervous system (SNS) and autonomic nervous system (ANS). For our purposes today, we’ll highlight the function of the ANS, which serves to regulate our viscera and glands. Importantly, almost all of the activity of the ANS resides outside the realm of conscious thought, meaning these processes are largely self-regulated. The ANS can further be dividing into the sympathetic and parasympathetic branches. In an attempt to avoid making the overly complex even more indigestible, I’ll describe these systems with terminology that most are familiar with:
These two branches are constantly in flux to provide the appropriate environment for our bodies to be successful during times of stress and to recuperate appropriately. In general, stress (which can come from ANYTHING, real or interpreted) causes a shift toward a more sympathetic state, which in many cases is the desirable response. Problems tend to develop, however, when an individual loses the flexibility in the balance of these two systems and excessively taxes one or the other. My understanding is that the most common example of this, and probably the most relevant to you, is that overtraining causes an undesirable shift toward a more sympathetic state, which, over time, will increasingly limit the individual’s ability to further adapt. This shift, as I alluded to, can be caused by a myriad of factors well-beyond programmed training stressors. Things like sleep, environmental toxins, dietary intake, alcohol consumption, occupational and relationship stresses all need to be consider. I believe that significant changes in these areas (even if for the better in some cases) can also be interpreted by the body as a form of “stress”.
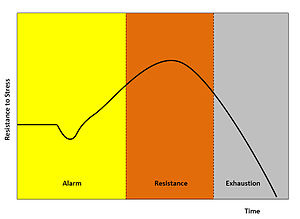
This idea is highlighted by Hans Selye’s General Adaptation Syndrome Model, which is founded in the idea that the body has both specific and general responses to stressors and that the general response is common to all stressors (although it may vary in amplitude).

An illustration of Selye’s 3-stage GAS model.
The introduction of a stressor causes an alarm reaction, followed by a stage of resistance, and finally one of exhaustion. It’s important that we monitor for the impact of stressors, from training and non-training sources alike, to ensure optimal adaptation. Heart rate variability provides an opportunity to do just that.
While the preceding discussion is fascinating, there seem to be more muddy than clear waters in the HRV research. While it may be too early to pin down precise physiological explanations for specific HRV measurements AND provide information on appropriate changes to restore optimal function, a huge value in monitoring HRV can be found in simply looking at time domain measures and monitoring for shifts toward higher or lower levels as an indication of the balance between the sympathetic and parasympathetic nervous systems. This is, following the longest introduction in recorded history, the value in Joel Jamieson’s new BioforceHRV system.

I truly believe that HRV assessment is the future of making training optimally specific to the individual; Joel’s new system is a simple, convenient, and affordable option to tap into that potential immediately. The book that accompanies the device will provide you with the information you need to interpret your own results, so you don’t need to be an HRV expert to use the system. Check out this link for more information: BioforceHRV and please post any questions or comments you may have below!
To your success,
Kevin Neeld
P.S. The future of strength and conditioning and sports performance? Check out this link for more information! BiofroceHRV
Please enter your first name and email below to sign up for my FREE Athletic Development and Hockey Training Newsletter!